 Logan Abounader
Logan Abounader
Logan Abounader
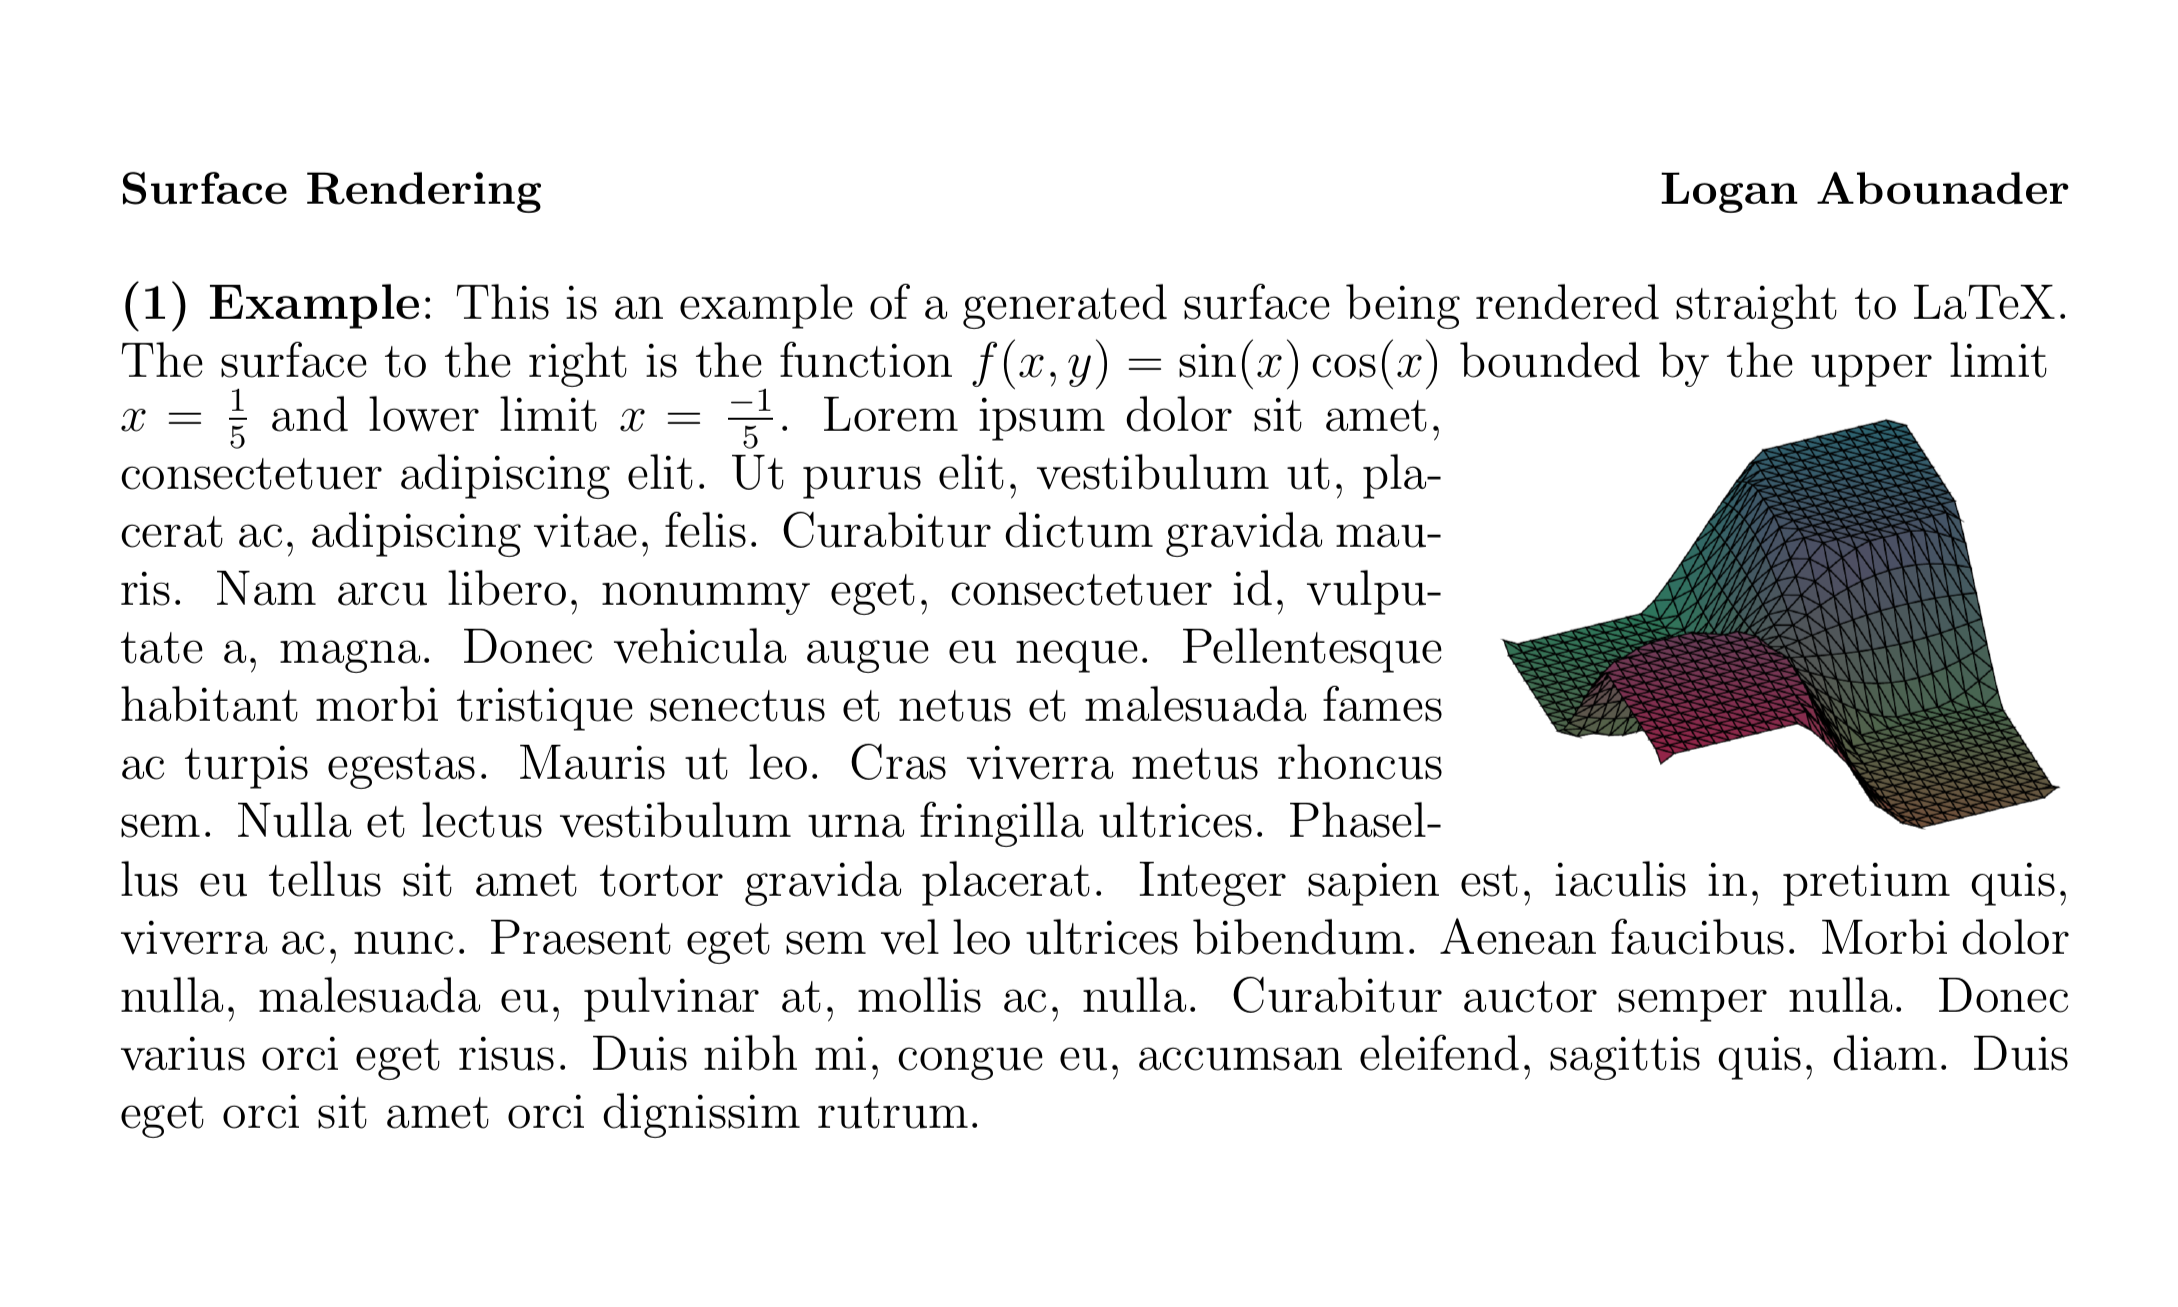
A graphics engine primarily for the purpose of visualizing multivariate functions. The visual outputs
of this code are created directly in LaTeX, with no intermediary. The actual evaluation and creation of
the mathematical surfaces is done entirely in core Java, relying only on personally developed resources
and infrastructure.
This project provides functionality for arbitrary functions which take the plane as input and output a
real number. The shading can be customized to be relative to the surface (as displayed in the animation)
or relative the world. Animations are handled entirely through this program, from creation of the
individual LaTeX files to compilation of generated frames into a video. There is further customizability
for back-end processes, such as the algorithm used in ordering polygons.
The motivation for this project arose from a graduate students' math talk on Harmonic Analysis. The
student proposed a solution to Dirichlet’s problem on S1. The solution which he presented involved
finding a Harmonic, Homogeneous function which agrees with any given multivariate function along the
unit circle. During this presentation I was imagining what the intersection of such two functions would
look like, assuming a visual would be provided. As a mathematician, he was content with only believing
the sound mathematical logic; I was not.
For that reason I began exploring ways to best visualize, and in the process gain a much better
understanding for, similar multivariate functions. A main goal of my exploration was centered around
LaTeX; the industry standard for math research papers. I believe that upon refining this project,
graphics produced by it could be included in a publication on Harmonic Analysis.
Creating a LaTeX interface to use in publishing a stand-alone TeX package.
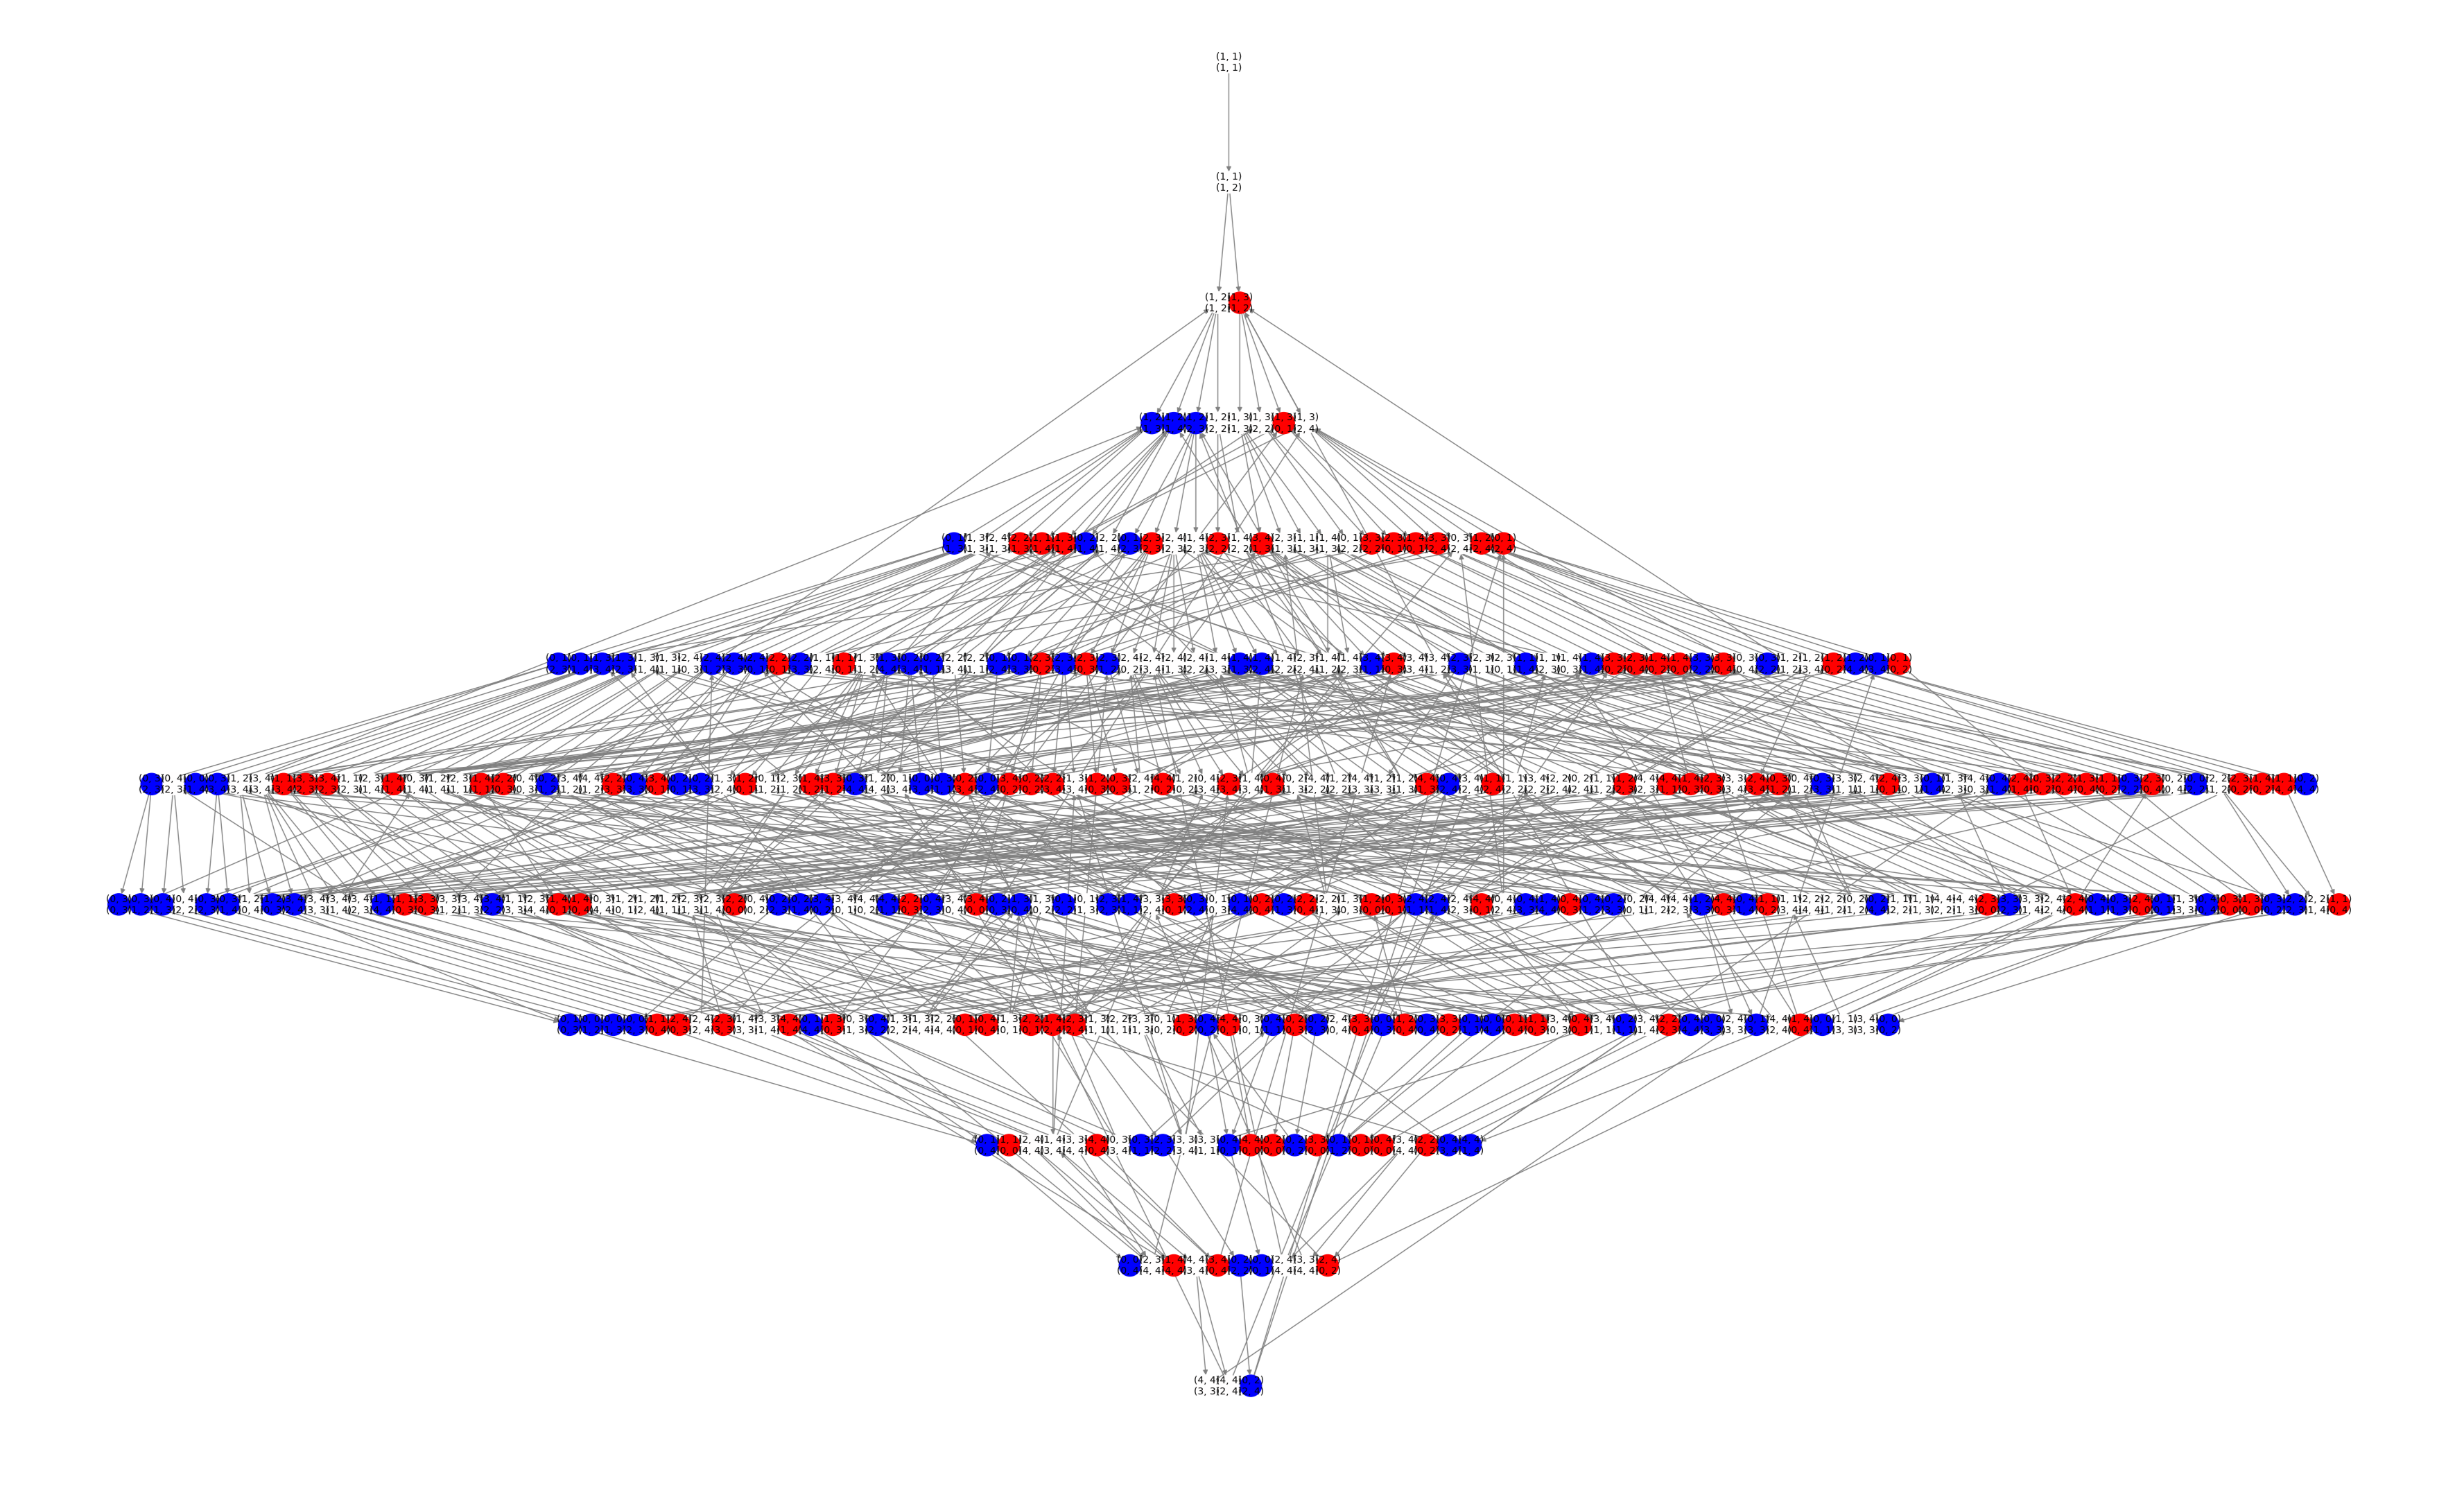
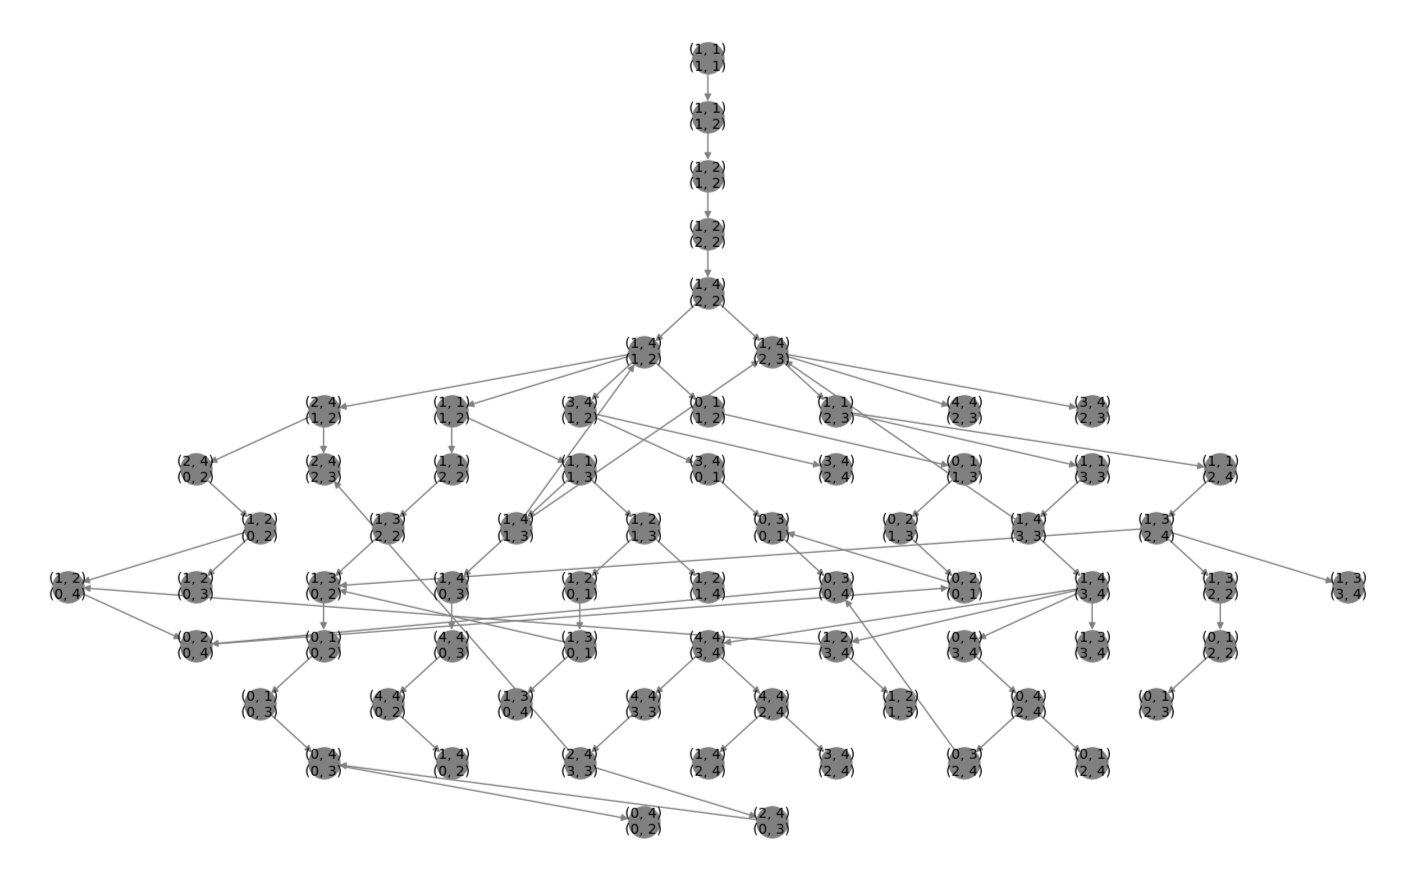
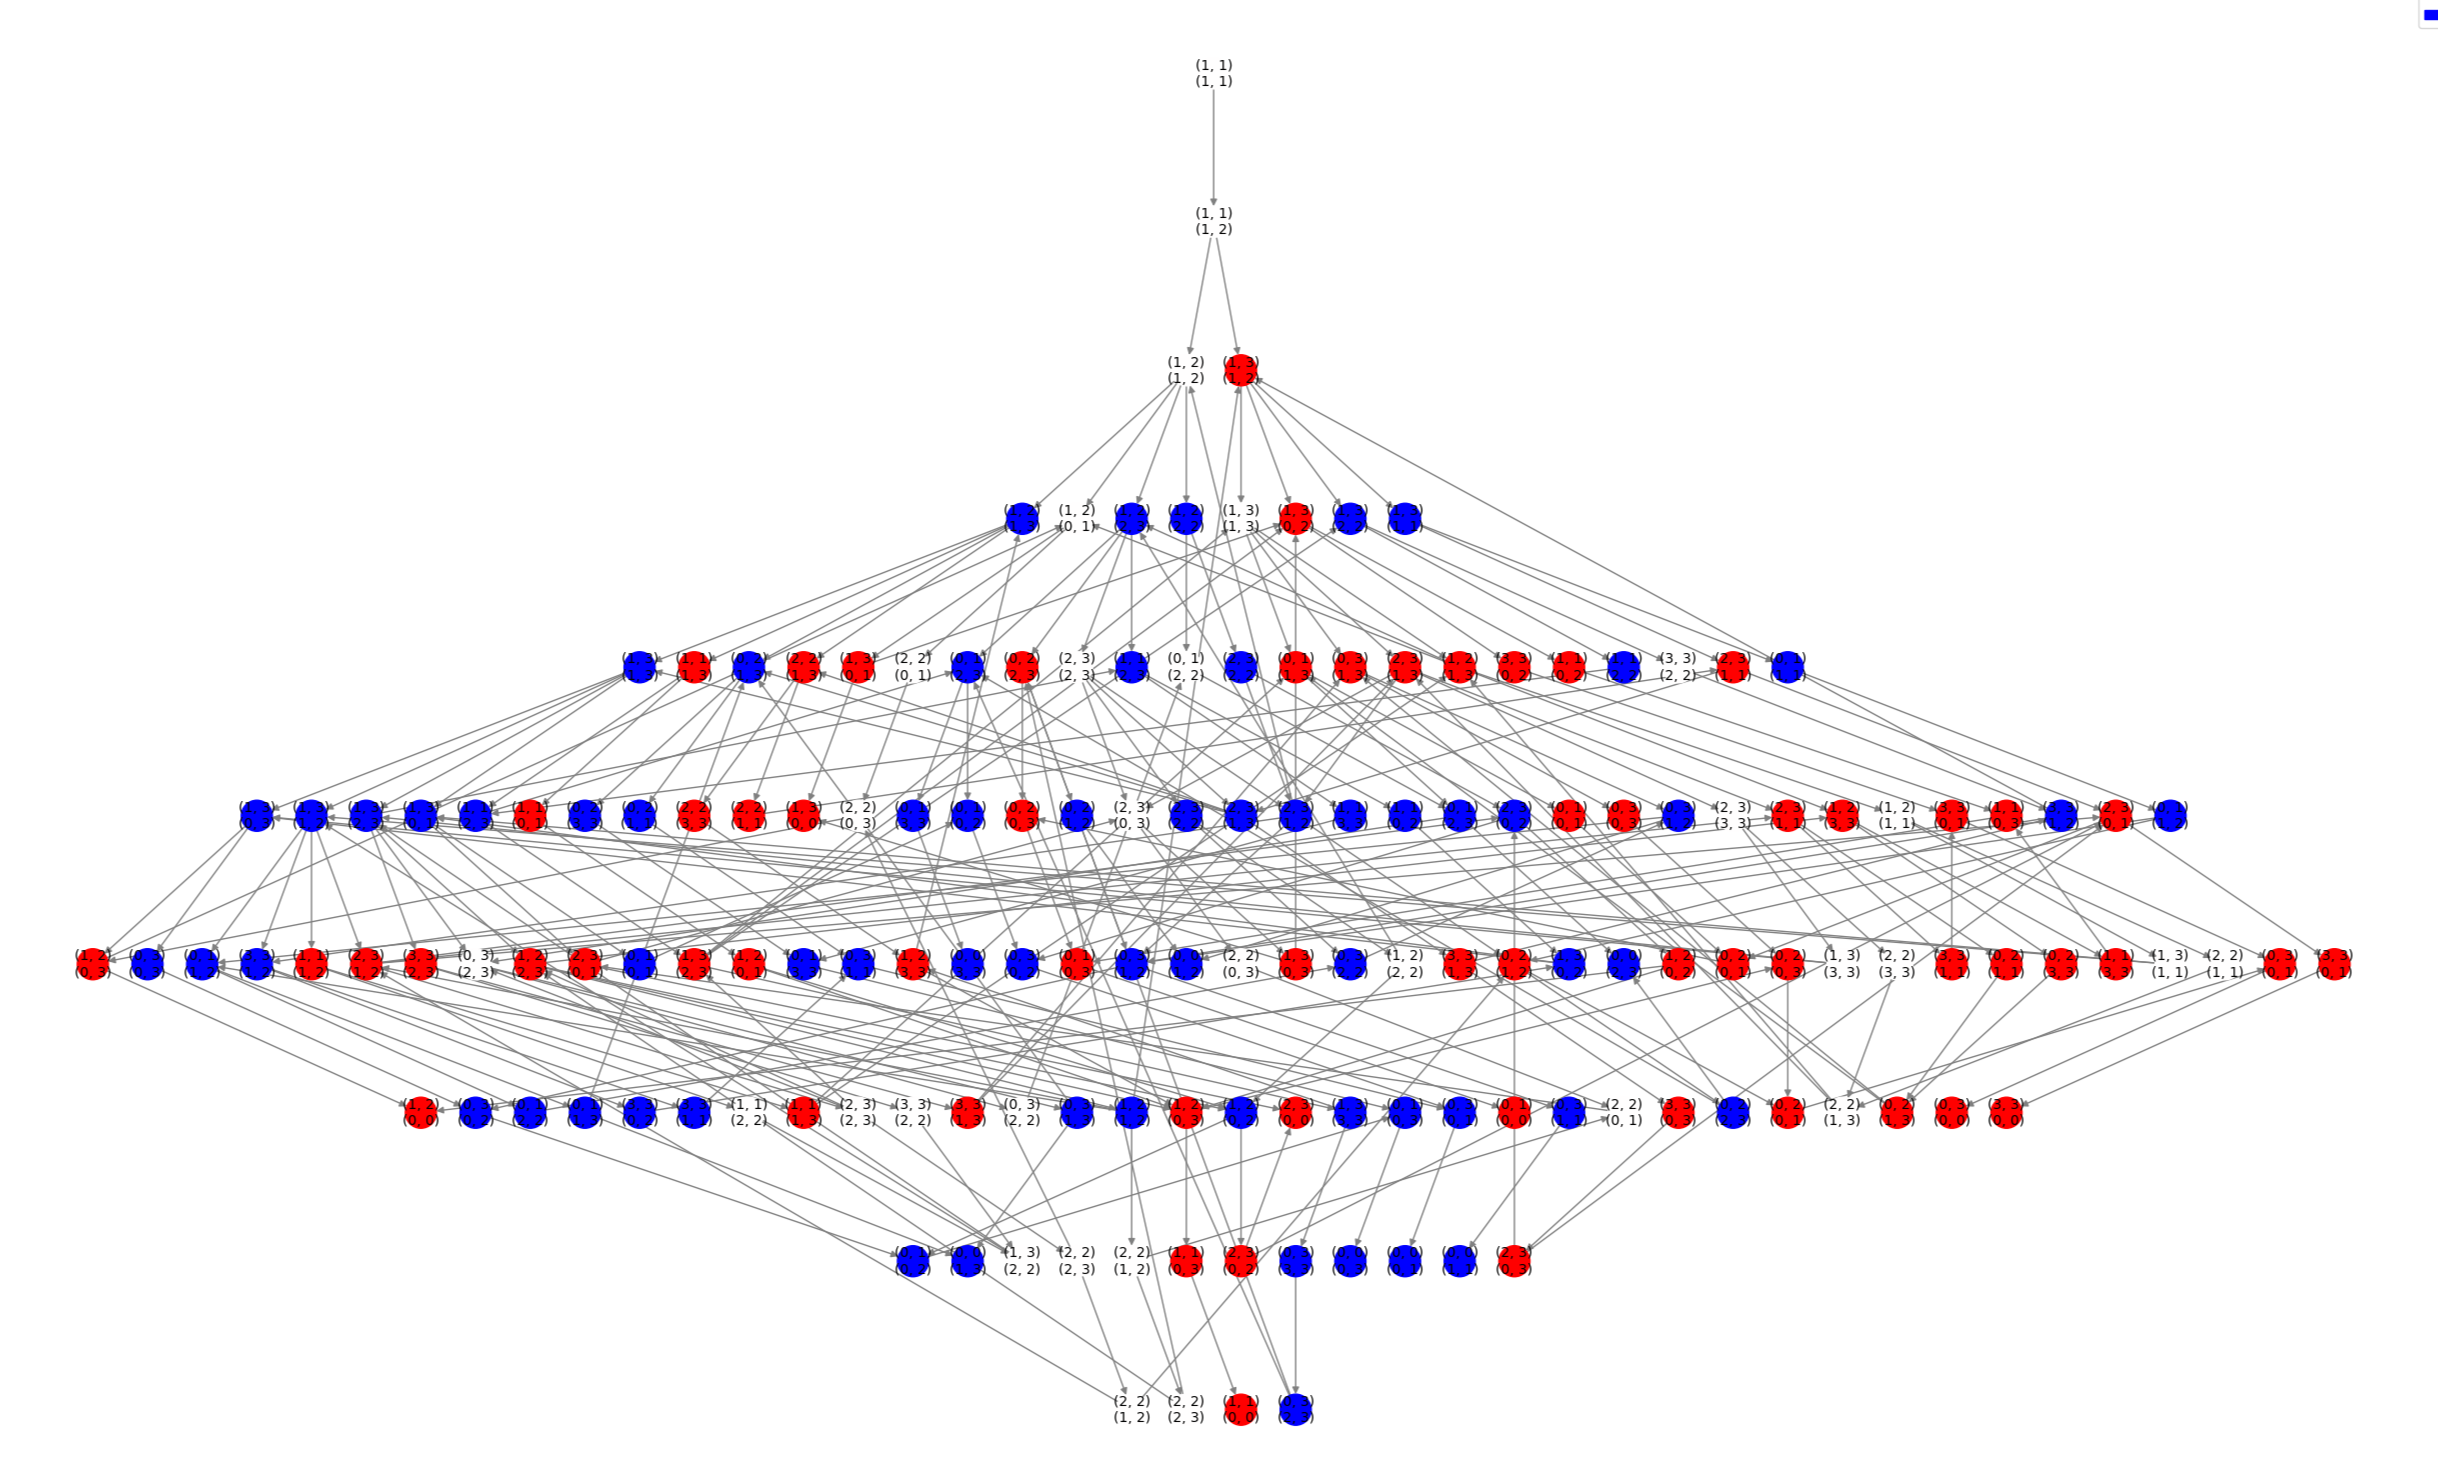
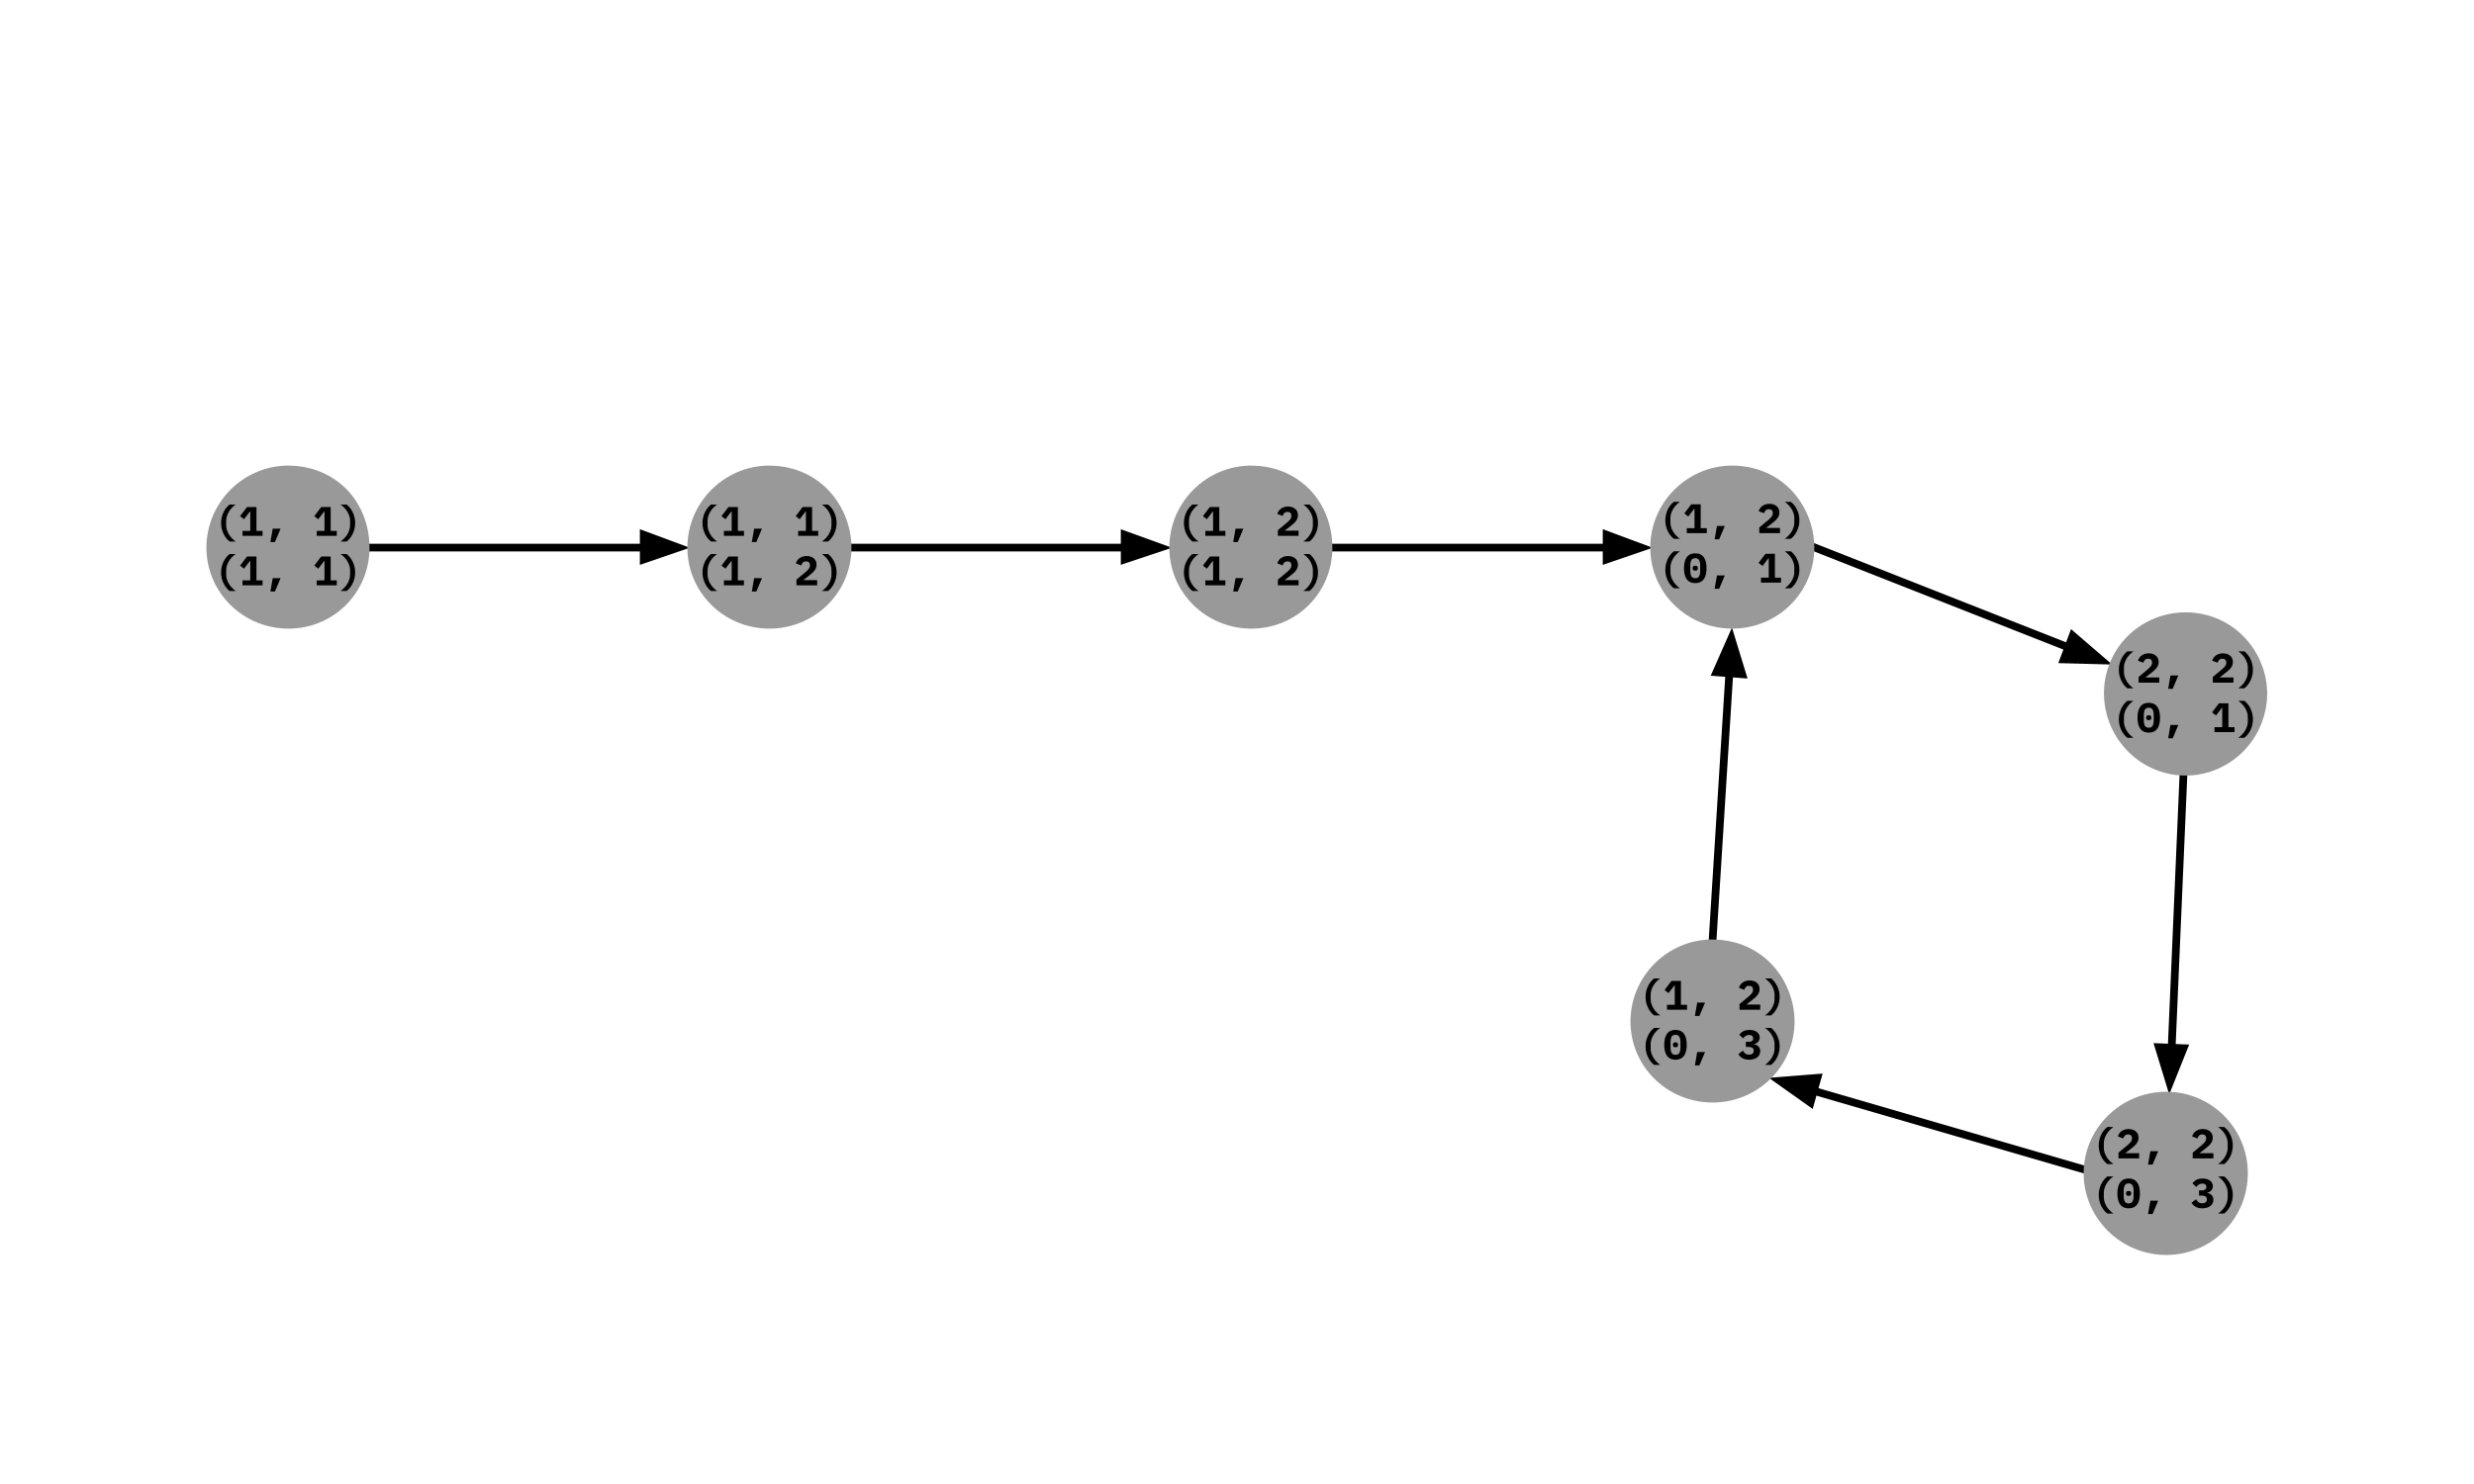
The principles of Game Theory applied to the Sequential, Perfect Information, n Player game of "Chopsticks".
This exploration not only led to code which maps the State Space of multiple moduli (2-7), but also culminated
in a traversel algorithm for best play. These visuals utilize a self-developed iterative algorithm for graph
traversel which employs Backwards Induction to maximize (or minimize as Player 2) the outcome of the game.
Reading the Graphs:
The colors of a graph node signify the outcome of the game considering best play by both players. A rendered node
is a winning position for Player 1, a blue node is a winning position for Player 2, and a grey/white node means
that with best play the game would loop indefinitely. Such a position is a tie as choosing to exit the loop is
undesirable for both players as it enters a losing position.
Images 1 and 2, Mod 5:
The most popular american variation of Chopsticks is played with modulus 5 and utilizes both hands. Image 1 is the entire
Solved State Space of such a variation. Node colors (see Reading The Graphs) correspond to outcome under best play.
The subgraph of the Solved State Space Mod 5 which contains only moves reachable under best play (Image 2). Any move not
represented on this graph would allow some player to force a win. This is the Strategy for Chopsticks.
Images 3 and 4, Mod 4:
The variation of Chopsticks Modulus 4, while not popular, has an interesting result when inspecting best play. Modulus 4
is the only (known) non-trivial State Space (Image 3) with a trivial best play subgraph (Image 4). While the game as a
whole is complex, in order to assure best play an Optimal Player has no move choices; they are forced to follow a single
path.
Currently authoring a paper based on the results of these computations.
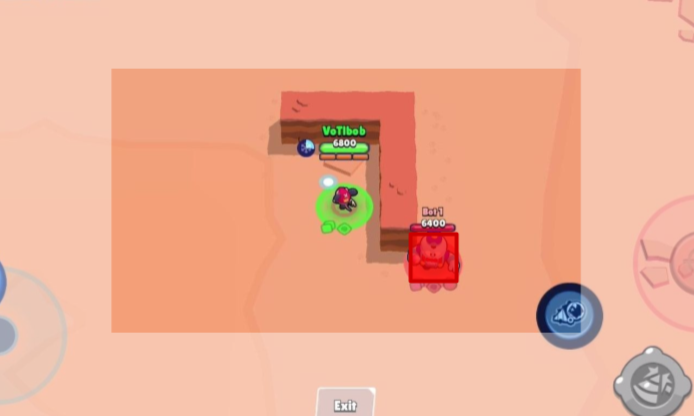
A Convolutional neural network tailored for detection of enemies in a multiplayer video game. This is the precursor
to an extensive Brawl Stars bot. All data was specifically generated and engineered for the purpose of training
this model.
Generating The Data
Frames were randomly extracted from scrapped videos and given a unique ID for later reference. I then wrote a small
application which allowed for the streamlining of the labeling process. Images were displayed consecutively, and in
quick succession, on a touch screen. The user would tap the location on screen where the enemy appeared, similar to
the manner in which CAPTCHA data is used for training machine learning models. By distributing this small software,
through crowdsourcing I was able to substantial increase the speed at which data was generated. Lastly, the unique
ID for each image was associated with its labeled coordinate pair in a JSON object.
Data Engineering Techniques
Since Brawl Stars is viewed from a fixed angle, the dataset could be doubled in size by reflecting training images
horizontally to help evenly distribute positions across the input space. Expanding on that idea, images had Random
Affine Transformations applied during training. This served two purposes; not only did it greatly diversify the
data by moving the detectable character across the screen, but it also increased the effectiveness of longer
training times.
Especially since the training dataset is (relatively) small, only around 2000 images, randomized transformations
provided increased value to fine-tuning by introducing diverse data. Another substantial technique for improving
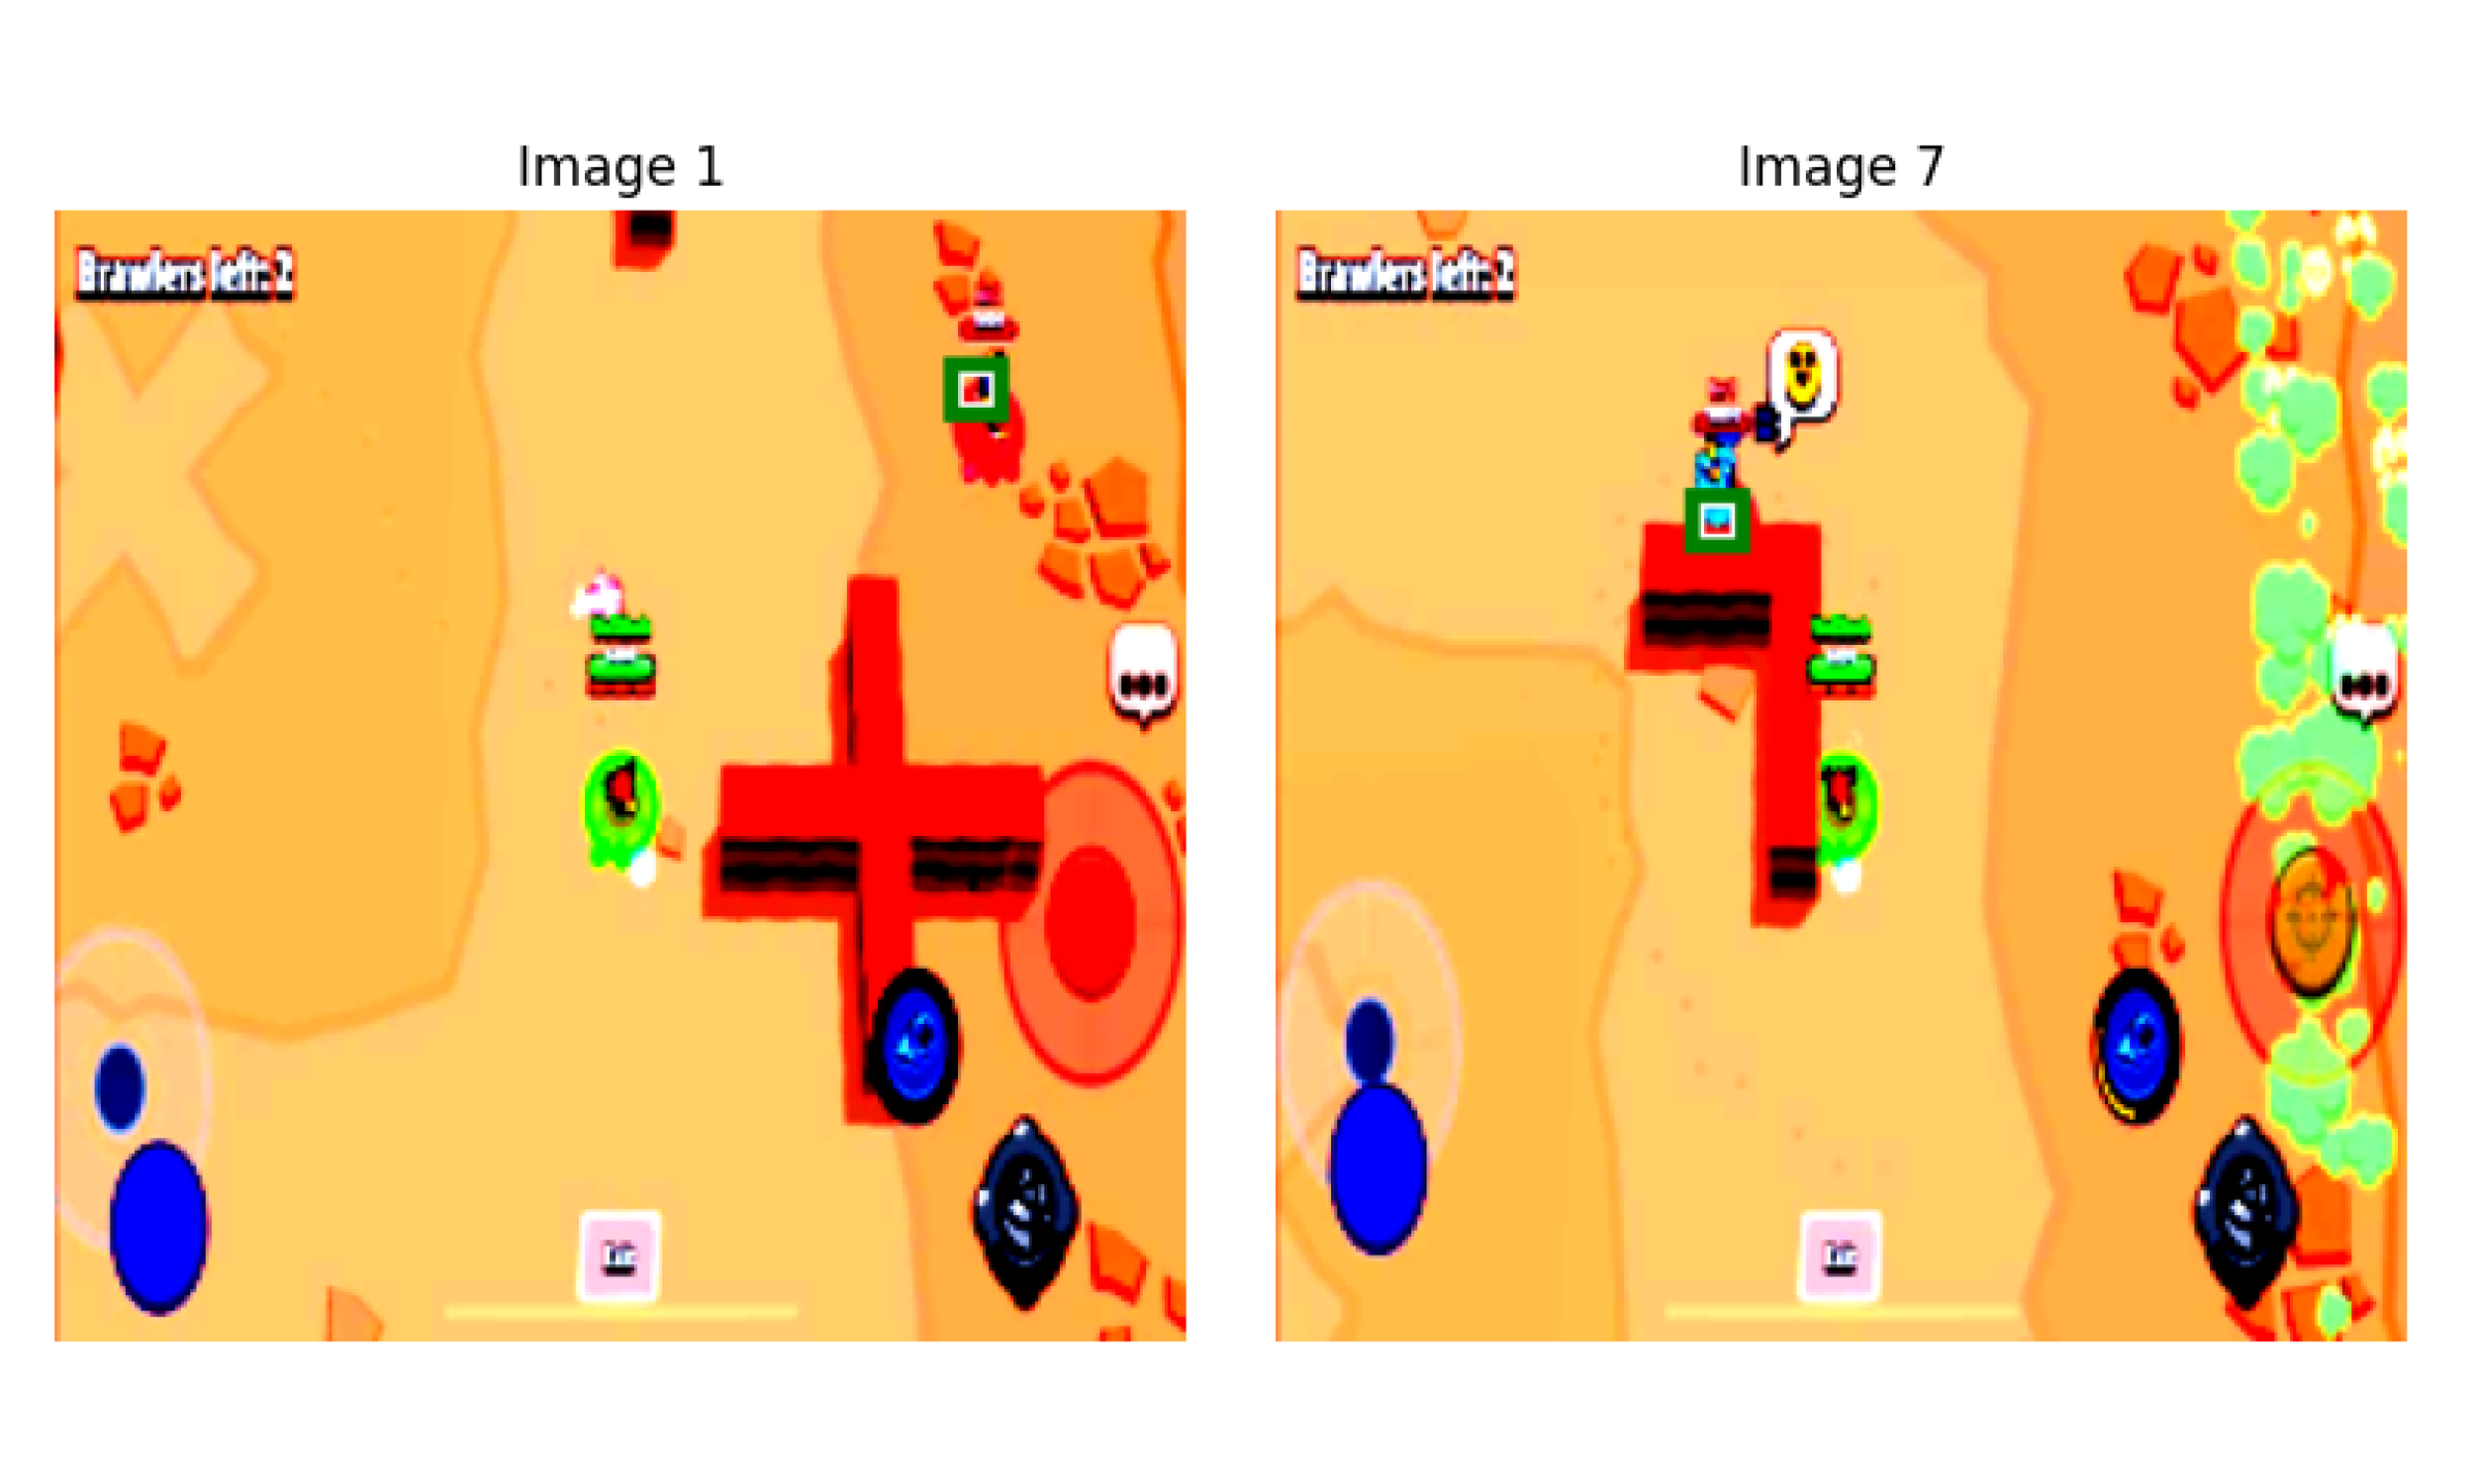
training through data manipulation was by semi-random masking. Sections of the input image which did not contain the
enemy’s coordinate pair had the possibility of being masked black. This helped distinguish the player's character
from the enemy, since they can look almost identical depending on cosmetic choices. It also served to mitigate the
negative effects of the hectic game environment, allowing for detection regardless of visual obstacles.
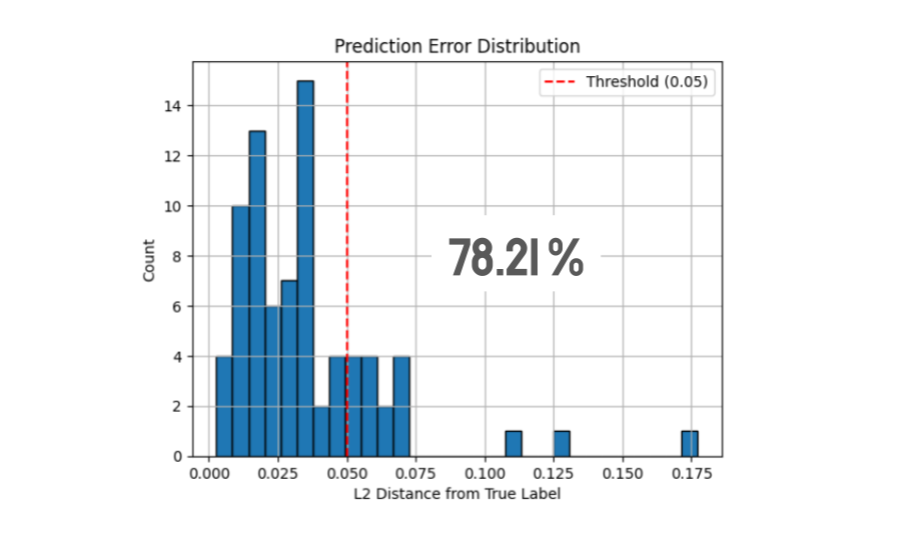
Analysis
When evaluated over the entire input space, 78% of the time the model output is within 5% of the width of the screen.
This contributes to the models significantly lower accuracy along the horizontal axis comapred to the vertical. The
model normalizes the width and length of the image to be between 0 and 1. Thus, since the screen is wider than it is
tall, a small difference in a prediction of the x-coordinate corresponds to a larger difference in the predited pixel
location than an idential change in the y-coordinate would. Algebraically, the scaling factor along the x-axis when
transforming from the predictiom space basis (the models output) to the pixel space basis (the location on screen) is
larger than that of the corresponding y-axis scalar.
Working to integrate Computer Vision model with game controls.